

Testers have a lot of project “health” data at their finger tips – data collected from others in order to perform testing and data generated from testing itself. And, sometimes test reporting gets stuck on simply communicating this data, these facts. But, if we simply report the facts without an accompanying story to give context and meaning, there is no insight – insight needed to make decisions.
With all the data we have close to hand, testing is in a great position to integrate data-driven storytelling into the various mediums of our test reporting.
“Stories package information into a structure that is easily remembered which is important in many collaborative scenarios when an analyst is not the same person as the one who makes decisions, or simply needs to share information with peers.” – Jim Stikeleather, The Three Elements of Successful Data Visualizations
“No matter how impressive your analysis is, or how high-quality your data are, you’re not going to compel change unless the stakeholders for your work understand what you have done. That may require a visual story or a narrative one, but it does require a story.” – Tom Davenport, Why Data Storytelling Is So Important—And Why We’re So Bad At It
This enhanced reporting would better support the stakeholders with relevant, curated information that they need to make the decisions necessary for the success of the project, and the business as a whole.
Not Your Typical Test Report…Please!
When thinking of test reporting, perhaps we think of a weekly status report or of a real-time project dashboard?
Often, these types of reporting tend to emphasize tables of numbers and simple charts and rarely contain any contextual story. Eg: time to do the test report: let me run a few queries on the bug database and update a list/table/graph, or two.
We need to thoughtfully consider:
- What information should our test reporting include?
- What questions should it really be answering?
- What message is it supposed to be delivering?
If we answered the following questions with just data, would we gain any real insights?
| Question | Data Provided |
| Is testing progressing as expected? | # of test cases written |
| Do we have good quality? | # of open bugs |
| Are we ready for release? | # of test cases run |
Obviously, these answers are far too limited, and that is the point. Any single fact, or collection of standalone facts, will be typically insufficient to let us reasonably make a decision that has the true success of the project at heart. [Ref: Metrics – Thinking In N-Dimensions]
To find connections and enable insights, first think about what audience(s) we could support with our data in terms of these broad core questions:
- How are we doing? (Status)
- What has gone wrong? (Issues)
- What could go wrong? (Risks)
- How can we improve?
Then we tailor our data-driven storytelling with a message for each audience to facilitate insight that will be specifically of value to them.
Test Reporting: Data vs. Information
An important distinction to make when thinking about increasing the value of test reporting is the difference between data and information:
- Data: Data can be defined as a representation of facts, concepts or instructions in a formalized manner which should be suitable for communication, interpretation, or processing by human or electronic machine.
- Information: Information is organised or classified data which has some meaningful values for the receiver. Information is the processed data on which decisions and actions are based.
– Computer – Data and Information, Tutorials Point
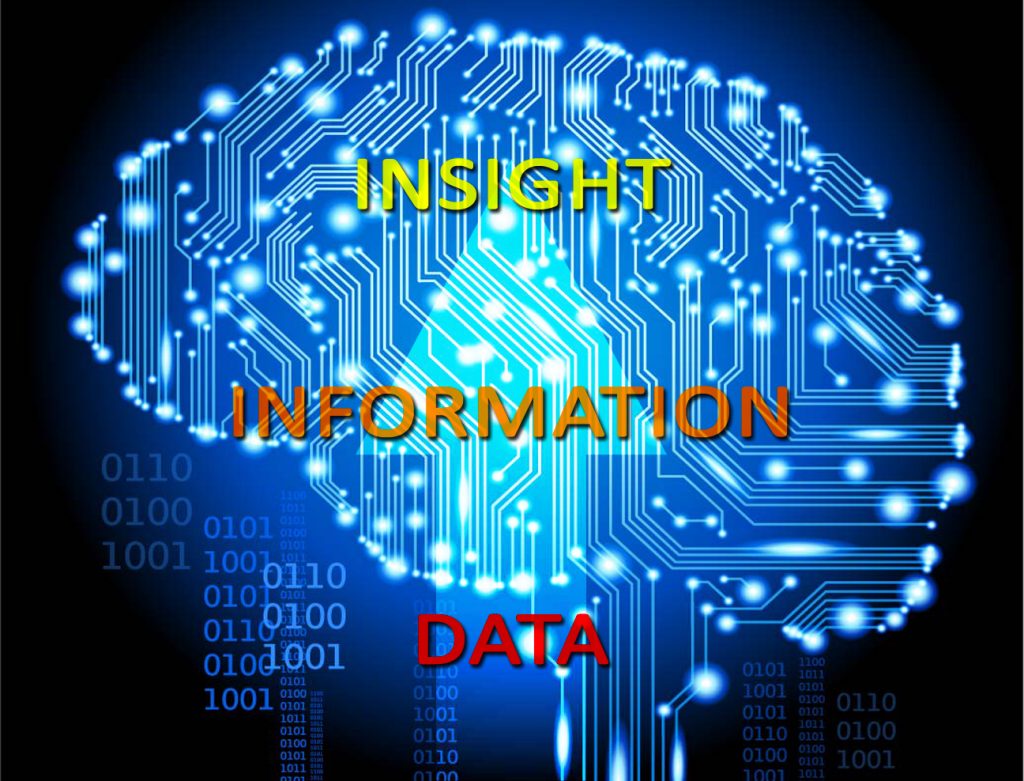
Data is not information – yet. Data is the building blocks we construct information from. When we transform data, through analysis and interpretation, into information that we make consumable for the target audience, we are dramatically increasing the usefulness of that data.
For example:
Or in the case of testing:
Through consumable information, we can help provide the opportunity for insights, but information is not insight itself. The audience has to “see” the insight within the information. We can only try to present the information (via whatever mediums) in a way we hope will encourage these realizations, for ourselves and others.
From Data to Decision
Once data is analyzed for trends, for correlations with other data, etc.; plans, choices, and decisions can be made with this information.
The following illustrates the path data takes to informing decisions:
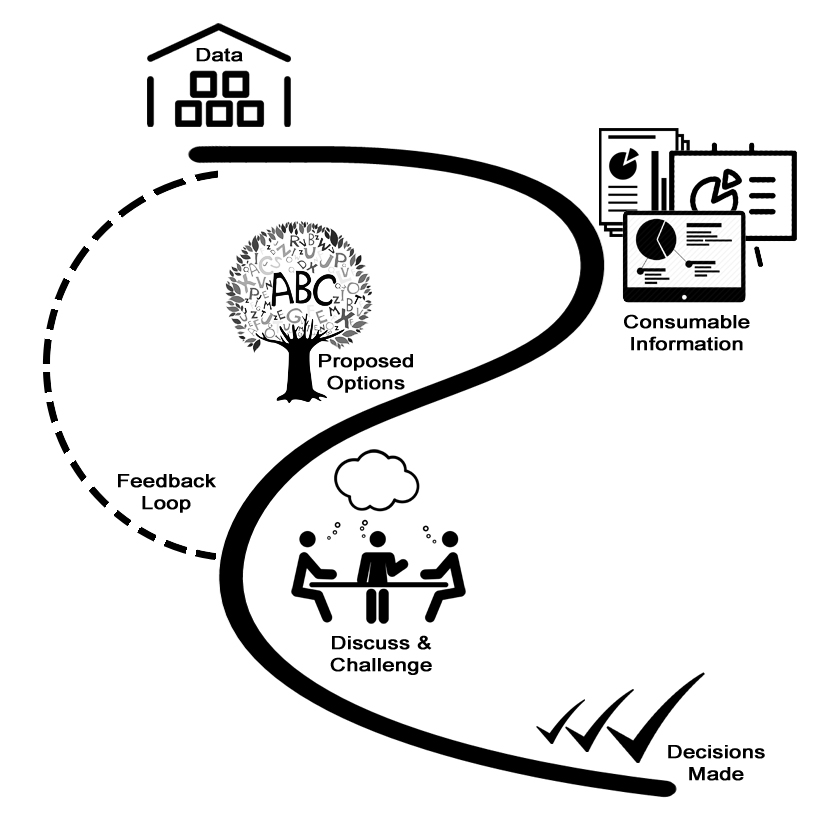
Figure 1: Test Reporting Data Path to Decisions
What data we are collecting, and why, should be firmly thought out. And then, don’t just report the numbers. Look at each testing activity and see how it can generate information that is useful and practical as input to the decisions that need to be made throughout the project.
- Data: <we’ll come back to this>
- Consumable Information: Testing takes the collected data and analyzes it for trends, correlations, etc. and reports it in a consumable manner to the target audience(s).
- Proposed Options: The data-driven story provided is then used to produce recommendations, options, and/or next steps for consideration by stakeholders.
- Discuss & Challenge: The proposed options are circulated to the stakeholders and through review and discussion, plans can be challenged and negotiated.
- Feedback Loop: These discussions and challenges will likely lead to questions and the need for clarifications and additional context, which can then send the process back to the datastore.
- Decisions Made: Once agreements are reached and the plans have been finalized, decisions have been made.
Of course, testing is not the sole party involved in driving this process. Testing’s specific involvement could stop at any step. However, instead of always stopping at step one with 1-dimensional test reporting, testing could make use of the data collected to move further along the path and to tell a more meaning-filled multi-dimensional story to a more diverse audience of stakeholders, more often.
Better Data – Better Decisions
In this way, the function of test reporting can be helping the project much more than it would when just reporting “there are 7 severe bugs still open”.
This is because our choices typically are not binary. We do not decide:
- Do we fix all the bugs we find?
- Do we find bugs or prevent bugs?
- Do we automate all the testing?
- Do we write a unit test for everything?
We decide to what degree we will do an activity. We decide how much should we be investing into a given activity or practice or tool.
This is where the first item in the list just above, data, comes in. Data lets us find out what trade-offs with other project investments we will have to make to gain new benefits. Data is the raw material that leads to insight.
So, in order to have “better test reporting” we need to make sure that we know what we need insight about, collect the supporting data accordingly, report the data-driven story, and then follow the path to better decision-making.
Better Data
Better Information
Better Decisions
For related reading, check out these articles: