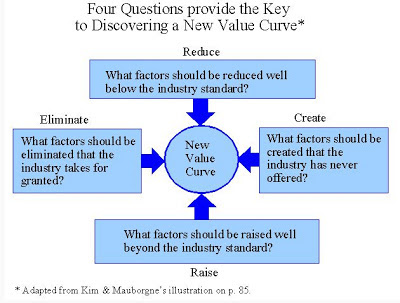
The content in this post is based on the exceptional book from ASQ Press, Design for Six Sigma as Strategic Experimentation by H.E. Cook. (ISBN 0-87389-645-9) pub. 2005.
While it is insightful for our profession to engage and embrace globalization, environmental sustainability, social responsibility, and the soft skills characteristic of advanced emotional quotient mentalities, it is imperative that we understand the purpose of our profession. We must advocate and promote value and protect against losses.
Cook’s excellent reference identifies strategic metrics for what is termed as “Total Quality”, which aspires to represent quality as the net value to society (complementing Taguchi’s definition of Quality Loss as loss to society). Where needed, I have augmented Cook’s list with additional metrics I have encountered in my professional activities.

Fundamental Metrics:
In a competitive environment, there are always pressures to increase the value, reduce the cost, and advance the pace of innovation. In litigious situations, risk management is established and sustained through legal and regulatory compliance, contractual fulfillment, corrective and preventive measures.
- Value to customer
- Cost (variable, fixed, investment)
- Pace of innovation
- Legal and regulatory compliance
- Contractual fulfillment
- Corrective and preventive measures
Bottom-line Metrics:
The outcomes of these fundamental metrics will be realized in what Cook terms “Bottom-line” strategic metrics. These transcend beyond the Quality function to influence financial and governance decisions.
- Working capital
- Market share
- Price
- Return on investment
- Internal rate of return
- Breakeven time
- Legal charges and penalties
- Inclusion to/exclusion from markets or industries
- Contingency requirements (based on assessed risks)
Cook uses the term “Critical To Value” (CTV) as the key measure to forecast changes to cost, customer satisfaction, and working capital. The attributes of products and services can be independently analyzed to determine the extent to which they are Critical to Value. Cook segments CTV into four Value Curves.

- Smaller is better (SIB)
- Larger is better (LIB)
- Nominal is best – with scaling factor (NIB1)
- Nominal is best – no scaling factor (NIB2)
As part of each value curve, the analysis includes a baseline value (V0) and an ideal value (Vp). In the LIB case, the ideal specification is at infinity, reflecting the infinite possibilities for value. These calculations are complicated by the presence of uncertainty and variation, which requires advanced mathematical formulae beyond the scope of this posting.
The high-level lesson is to understand how to establish the CTV measures for each attribute of a product or service, and translate those measures into tangible metrics.


