
Our home shines dimly with reflected sunlight, a pale blue dot in the expansiveness of space. Around us, dark shapes move through the skies, in near countless number. Some few trend in our direction. Not seeking, but tending inevitably toward us all the same. A still smaller number of these will collide brightly upon our atmospheric shield. In a rare while, one burrows past to impact heavily upon the body of our planet. Will the next such be a planet-killer?
Watching Near Earth Objects (NEOs)
Consider: Asteroids are one type of risk to the viability of “project” Earth – Did you know?
- Earth is bombarded with over 100 tons of material from space every day
- There were 609 close-Earth approaches (within 0.1 AU) by Near-Earth Objects (NEOs) between November 2012-2013 with 62 of those being Potentially Hazardous Asteroids (PHAs) – http://neo.jpl.nasa.gov/ca/
- An estimated 500 meteorites reach the Earth’s surface each year
- Asteroid Impacts: 10 Biggest Known Hits, Brett Line, National Geographic News
- The Chelyabinsk meteor of February 15, 2013 went undetected until entering Earth’s atmosphere over Russia
- The US Government spends 1/4000th of 1% of its annual budget watching for asteroids – Neil deGrasse Tyson (part 1, part 2)

By Alex Alishevskikh (Flickr: Meteor trace)
[CC BY-SA 2.0], via Wikimedia Commons
Approximately 10,000 NEOs are currently being tracked. More objects are continuing to be discovered. Almost daily impacts on the Earth’s surface. Seems like we should be worried!
What are we doing to safeguard our only home from this external risk? Is it enough? … Do we care?
Why Aren’t You Listening?
What does this all have to do with your software project? Well, have you ever been on a project where you felt it might be doomed if something isn’t done? Did you tell anyone? What was the reaction? What about after the 10th time?
After a while, doomsayers and the dooms they say-on about tend to be tuned-out – especially perhaps if the doom never happens (“I’m not going to fall for that old line”) or if it regularly happens (“We came through it ok last time”).
So how can you clearly point out real Project-Killing Risks of Doom and make sure they get the attention they need?
Risk Management Basics
Risk in software can be defined as the combination of the Likelihood of a problem occurring and the Impact of the problem if it were to occur, where a “problem” is any outcome that may seriously threaten the short or long term success of a (software) project, product, or business.
Managing risk involves:
- Identifying potential direct and indirect risks
- Judging the Likelihood and potential Impact of a risk
- Defining mitigation strategies to avoid/transfer, minimize/control, or accept/defer the risk
- Monitoring/updating the risk
So, what are the risks on your project? Can you think of two? Twenty? More?
How do you know you have them all? Regardless, do you have the time/money/ability to address them all?
So which do you really need to actively care about? Which do you “eat-healthy-and-exercise” for? Which do you have to plan for just in case? And, which do you … just ignore?
We Have a List of Risks, Now What?
Let’s write our risks down in a central place so that:
- We can append new risks while not needing to actively remember the risks identified previously
- We can quantify each with a relative priority or ranking (Risk-Value) agreed between the stakeholders for the current context (eg: subject to revision and re-ranking)
- We can attach a mitigation and/or contingency strategy to each
We could start with a simple table like the following:

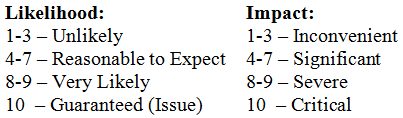
In the above table, the Risk-Value is a function of the Impact and the Likelihood of a risk, where Likelihood and Impact could be rated by the following:
At another point in the project, we can get fancier with a detailed risk registry to track more information including costs for contingency and mitigation, progress of mitigation strategies, post-mitigation Risk-Value targets, trend of total project Risk-Value vs goals, etc.
But right now, we are primarily concerned with identifying the Project-Killer risks (if there are any) so we can doom-say with supporting data in hand, and get the attention/funding for mitigation strategies and contingency plans.
The “Trick”
In the face of a large number of risks, a visualization tool is helpful. We need to be able to see the leading risks, ideally clearly separated from the rest of the pack.
For the purposes of this illustration, let’s make the assumption that Likelihood and Impact have equal weight for our project, eg: the very likely occurrence of an inconvenient impact is as important as an unlikely occurrence of severe impact for a given scenario.
Then, let us consider the following formula using 100 randomly generated value pairs for L and I: Rv = (L + I)
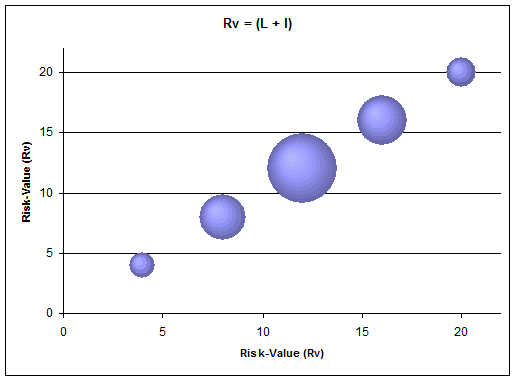
A pretty standard distribution from randomly generated input values with a linear relationship. This formula is fine for ranking the risks by our above assumption and we can make a “Top Ten” list easily enough.
But can we say that the 11th risk is significantly different from the 10th? And so, would it be correct to not spend any time/$$$ mitigating that risk? Or the 12th or 13th, for that matter?
Let’s try applying the following formula to the same input data: Rv = (I2 + L2)
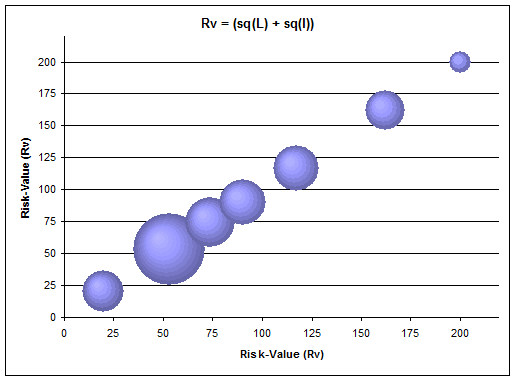
This time, we get to see both the ranking per the assumption we made AND we get to see groups of risks cluster or separate out from each other as the formula works to emphasize or de-emphasize the combined input values respectively.
Our Top Ten Risks List is now much more obviously a “Red Risks List”. We can more easily see where we should first look to spend our limited time and $$$ to actively work on improving the situation, where an adjusted plan to “eat-healthy and exercise” could potentially have a wide benefits, where to plan contingencies rather than mitigation, etc.
Notes:
- Learning to identify risks and judge their impacts and likelihoods relative to each other, the project, and the outside world is an acquired skill. Practice.
- When ranking risks, thinking short term vs. long term can change the rating. Consider both.
- Adjust the formula to best fit your industry/business regarding the relative importance of Likelihood and Impact.
- Add a graph like this to your project dashboard, where you can drill-down to the groups and individual risks.
- This is just one view on the data. For example, another important view would be show which risks have a high Likelihood OR high Impact regardless of the other value in the pair.
Conclusion
Do we need to care about every big and little thing that is spinning about in space? What is really the risk?
We have our atmospheric shield that protects us from the vast majority of impacts with no effort from ourselves. The ones that do get through do less damage than putting a hole through a roof, typically…
We need to gauge both the Likelihood and the Impact of converging orbits with each NEO. NASA uses the Torino Impact Hazard Scale to categorize the overall risk for each NEO as: No Hazard, Normal, Meriting Attention by Astronomers, Threatening, or Certain Collisions
Viewing the list of currently tracked NEOs against this hazard scale on NASA’s Sentry Risk Table, things suddenly don’t seem so concerning anymore (undetected objects aside). But if there was something to worry about, it would show up clearly as a glaring red row in amongst the blues, whites, and rare green – demanding attention. And then, I think we will suddenly care a lot.
Similarly, on your software project, not every risk is as important as another. However, until you have a list of risks that was contributed to by all stakeholders, how can you say with confidence which are which?
Don’t leave it to someone else to identify and rank the risks to software quality and to the success of the test effort on your project. Make sure that you are included and are participating – or your dooms might not get said.
And if, together, you can support your concerns around software quality with a data-driven approach, they will be less-likely to be “tuned out”.
All the risks can then be assessed objectively against each other – thereby aiding conscious, intelligent decision-making regarding which are the “Red Risks” and how ultimately testing can best help with mitigation – it might not be how you first thought it should.