The Return Of Dendrograms

What is Dendrogram-Based Testing? Well, what is a dendrogram to start with?

A dendrogram is a tree diagram that visualises hierarchical clustering. If that didn’t help, a dendrogram basically groups objects in a tree view based on how similar they are. The closer the objects are drawn, the more similar they are.

Thanks for the maths lesson, but how is that useful in testing?

Good question. I’ll come back with a final conclusion later in this post, but I can think of two uses for dendrograms:

Clustering defects: Visually show how similar the defects previously found are.

Clustering test charters (test cases): Visually show how similar planned test charters (or test cases) are.

In order to create dendrograms we need the objects, e.g. defects, to have such properties that we can measure distances between them. This is where it starts getting tricky – how do we measure the distance between two defects? The simplest thing to do is to think of properties we believe to be important and then assign them numeric values.

One example could be the property “User” (P1) and we could assign a defect a value between 0 and 5 for this property depending on how affected we think the user is by this bug. Another property could be “Performance” (P2) or “Business” (P3). Imagine we are testing a web shop and have two defects:

B1:The “This is a gift” checkbox is missing in the GUI.
B2:Memory issue that slows shopping down when you have more than 10 items in your cart.

Each of the two bugs have the properties P1, P2 and P3, and we might to assign values as follows:

B1: P1=5, P2=0, P3=2
(the user is affected, the performance is not but the business flow is also affected)
B2: P1=3, P2=5, P3=0
(some users will be affected, the performance is affected, the business flow is not affected)

Based on these properties we can now see how similar the defects are in a dendrogram. In my earlier post I explained how to create a defect dendrogram with simple example, and I’m not going to repeat that.

Similarily we can assign test charters or test cases properties and create dendrograms. Here properties could be which actors, functions or areas that are involved, and the dendrogram shows a kind of test coverage. If all test charters are grouped together, they test very similar things.

So how do we base our testing on dendrograms?

A defect dendrogram would of course be used to decide where to focus testing. I think isolated defects would be my priority. A single defect far away from all other defects seems too unlikely, maybe there are more hiding that need to be discovered. Then again, if a large number of defects are very similar there is reason to believe that area requires special attention.

A test charter dendrogram would of course be used to help decide which charters to add. A single isolated test charter might be ok for a low-risk area, but might also be a warning flag.

Is this useful?

I have some serious doubts. Firstly, we need to find useful properties and assign them subjective values. The dendrogram will be based on those values and nothing else, so there is a huge risk of bias. Secondly, I have yet to find a good tool to use to draw dendrograms. With more than three variables (defects/test charters) and two or more properties it cannot be done by hand. Of course, writing your own tool would not be too complicated.

Right now I don’t think the value gained outweighs the effort needed. I’m very interesting in hearing arguments that I’m wrong though.

Posted in  All, Planning for Quality | Tagged , , , | Comments Off on The Return Of Dendrograms

A Remote Tester’s Perspective – The Challenges and Solutions

On October 27, 2011, Keith McIntosh presented “A Remote Tester’s Perspective: The Challenges and Solutions” at the Software Test Professionals Conference in Dallas, Texas.

Much has been written on the many challenges associated with remote testing locations whether they are onshore, nearshore or offshore.  The notion of utilizing remote testing teams may be a scary challenge or dismissed without consideration.  This is largely due to the distorted views projected by past examples of poor quality and communication barriers within remote testing projects.  Attending this session provided participants with insight into the world of a remote tester and the struggles and challenges that need to be overcome.

View the full presentation …

Posted in  All, Business of Testing, Team Building | Tagged , , , , , , | Comments Off on A Remote Tester’s Perspective – The Challenges and Solutions

Scalable V-Model: An Illustrative Tool for Crafting a Test Approach

I recommend a testing approach that is risk-driven, leverages agile principles, encourages early validation and verification activities, reports progress with practical metrics, and is controlled through hand-offs and acceptance criteria overlaid on the development cycle via a scalable “V-model” (whether Agile, Iterative or Waterfall).

We can apply and tailor our test approaches to match an organization’s development and testing life-cycles, always keeping their project constraints and business goals in mind. Continue reading

Posted in  All, Planning for Quality, Test Planning & Strategy | Tagged , , , | Comments Off on Scalable V-Model: An Illustrative Tool for Crafting a Test Approach

Dendogram-Based Testing

Friday afternoon I was looking through the latest tweets when my eye was caught by the phrase Dendogram-Based Testing. I like all words that have a Greek origin and sound like science, so I had a closer look, and of course it was James Bach introducing a new concept. One that – as far as I understand – is still pretty much missing a definition. No reason to let a small detail like that stop you, right?

After reading up on dendograms I realized that I have actually used them before, but didn’t know they were called dendograms. A dendogram is basically a way to take data points and cluster them based on their properties. They are commonly used in computational biology, and that’s were I encountered them. About a year ago I spent a week of my vacation making dendograms from genome data.

In testing, one way to use dendograms would be to cluster defects. In order to do this you would need to define a set of properties for each defect, and based on these properties it would be possible to calculate distances between the defects and cluster them in a dendogram. I will save the discussion on whether this is useful or not for later.

Example: The android game SuperTester

To the best of my knowledge this game does not exist, but if it did it would be a game in which the player has to find critical bugs in imaginary applications under time pressure. Just for the record, I haven’t thought too much about this so I’m just making it up as I go along.

Let’s say five bugs have been found when testing the actual SuperTester game:

1. Can’t save game (D1)
2. Can’t change sound volume (D2)
3. It is possible to register the same bug twice (D3)
4. Application crahses if you find exactly 13 bugs (D4)
5. Application crashes if you play for more than 59 minutes and 59 seconds (D5)

Now we need to assign these defects properties in order to cluster them. This is the tricky part and requires some careful thinking, Which properties you pick decide what information you will get out of the dendogram. For now I’m just going to pick two properties for the sake of creating an example,

1. Frequency of occurrence on a scale 1-10, where 1 is rarely and 10 often (P1)
2. Severity of defect on a scale 1-10, where 1 is not severe and 10 is very severe (P2)

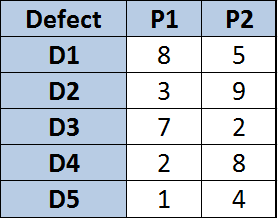
Time to make a table:

Table 1Defects with assigned properties P1 and P2
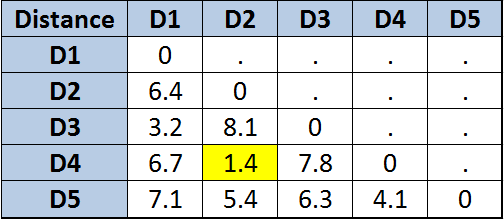
Ok, the values might not make so much sense but let’s ignore that for now. We have everything we need to calculate the distances. Note that all this assumes that the properties are numeric, if you have other properties such as “red” or “green” you need to decide how to calculate the distance between “red” and “green”. For numbers we use the Euclidean distance. I’m not going to go through all the boring details, but the distance table will look like:

Table 2Distance table

D2 and D4 are closer to each other – that is, more similar – than any other defects. Hence we cluster them in cluster A. And so it goes on. What we end up with is the following dendogram:

DendogramDendogram. Defects are clustered based properties
That’s it! Two important points here are i) you need a tool because you definitely do NOT want to do this by hand and ii) how about non-numeric properties, how do you measure distances? I definitely think dendograms can be useful, but a tool needs to be found and then there must be some thought on which properties to use – what kind of information do we want from the dendogram?

This post is just a collection of initial thoughts and is focused on what a dendogram is. I will now crawl back under the rock I came from and think more about how to actually use it for testing.

Posted in  All, Planning for Quality | Tagged , , , | Comments Off on Dendogram-Based Testing

UAT as a Lean Startup

User acceptance testing (UAT) – that misunderstood human activity that is squeezed from front to back by late delivery and set-in-stone go-live dates – is an opportunity to use lean tactics.

The user acceptance team is a cross-functional team. An enterprise solution will have many different flavours of technical folk and an equally diverse range of business folk. If it were a coach on the sidelines, Lean would say to bring those diverse individuals together early to craft an approach together.

The time allocated to UAT is fixed, and might shrink. Our coach Lean would say better to identify those things that really matter and get to them first. An excellent example of a context for relentless prioritization.

The technologies you use to set up, track, and communicate with don’t have to be the expensive ones. Lean would say you can be capital-efficient by favouring simple tools – checklists over test management systems, burndown charts over tool-generated coverage reports, a kanban board for discovered issues over a defecting tracking system (issue severity is a natural attribute to use for defining classes of service).

Then there’s the communication piece. As lean is transparent to and inclusive of the customer, UAT is transparent to and inclusive of its customers – developers and those people making the acceptance decision. Constant communication and adjustment should be expected, and given. The coach would suggest that since a decision is required, asking what information those decision-makers need in front of them to make that decision is prudent. And do that at the beginning.

Posted in  All, Agile Testing, Planning for Quality, Test Planning & Strategy | Tagged , , , , | Comments Off on UAT as a Lean Startup

Working with Business Testers

From Nancy Kelln’s presentation at STPCon, “Leading Business Testers”, business testers:

  • are not testers
  • do not want to be testers
  • require guidance and support
  • require their expectations to be managed
  • may be working part-time on the project

and all of these things need to be considered when creating the test strategy/approach on a project that will utilize them.

My last two projects as QA/test lead launched for 3500 and 7500 users respectively, and I can say that we only used a smattering of professional testers on those projects (not counting the professional testers that might have been working for the vendors). The end-of-cycle testing was all done by business testers, that is, people that would be classified as full-time end-users of the solution.

I can add the following to Nancy’s list:

  • business testers tend towards happy-day scenarios; adjust your coaching so they get a sense of what exploring means
  • avoid technical testing terms like boundary value analysis, equivalence class partitioning, etc. in your coaching; introduce the concepts but using examples
  • removing obstacles to their testing is critical, especially since they rarely differentiate between a test environment problem and a problem with the solution – it’s all the same to them
  • you can use session-based testing and call sheets as a way of managing part-time testers; a call sheet tells them what to investigate, when and gives them space to report back in. I populate the call sheets with items from a main checklist everyone is working from.
  • as a test lead, avoid becoming a test enforcer – you won’t be able to convince them to test in a timeline that actually helps you. Instead, make them aware that they are driving the investigation in their area and that how much they test is their decision; then communicate, communicate, communicate what they have told you and what they end up doing.
  • business testers can absolutely use exploratory testing even in projects with stringent audit and control requirements; you do need to state that this is the process you will follow, and then be able to demonstrate that you followed that process. You will need to instruct the testers on what evidence they need to gather for you.
  • another risk is what I refer to as cloister vision – the business testers get too good at using the system under test and are no longer adequate proxies for the end-users that will soon be required to adopt the solution; mix it up a bit if you can. A core of business testers is a good idea when they are providing test data for downstream workflows but for investigating solution adoption concerns, work with the training people to get some additional testers that have been trained on the solution involved so that you can observe the “unboxing” first-hand.

That last one – cloister vision – was largely responsible for go-live complications that involved call centre software. Yeah. My customer’s customers noticed, and that hurt, big-time. It’s why I keep writing about solution adoption considerations and have started using “deployment is not done” as a mantra.

Posted in  All, Test Planning & Strategy | Tagged , , , , , | Comments Off on Working with Business Testers

Feature Advocacy

Take everything you know about bug advocacy – the art of maximizing the likelihood that any given bug is fixed as per its impact on those who care about it – and direct it towards feature advocacy – the art of maximizing the likelihood that any given feature might be adopted as per its value to those who would use it.

In a world where the concept of a ‘project’ as a way of working is being eaten away by pull systems and continuous delivery models, one possible side effect is the death of the bug report.

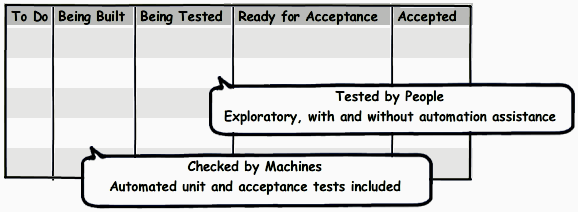
Features (user stories, etc.) are either ready to be adopted by the user community, or they are not. As complex and subjective as that decision might be, it is still ultimately a decision that a person makes. As testers, we investigate and explore and communicate so that the decision is an informed one. The people employing a pull system might require a few more columns than just two – but fundamentally, there is ultimately a state that a feature must reach that says, “as far as we can tell, we can adopt this.”

Feature Advocacy - Figure 1

Everything we gather during testing is data about that particular feature – successes, failures, shortcomings, omissions; its beauty, economy, utility – and all of that information should be available in making that decision. Whether or not that feature plays well with other features is still information about that feature, especially if that other feature has already been in active use. We either move the kanban for the feature to the right, or we do not.

So why create a bug report? Why introduce a whole new ‘thing’ to create, resolve, test, re-open, close, etc.? Why not just add to the information that is known about that feature and ask the appropriate authority to either move it to the right, or send it back to the left?

I understand that there is the capacity for kanban to include a ‘bug’ work type, and a class of service that gets serious ‘bugs’ resolved sooner. The detachment of that ‘bug’ that prevents the adoption of another work item on the board – the feature that was being explored when the ‘bug’ was identified’ – is a problem to me and I would vote for splitting the feature if and only if some of the original feature could still be adopted (or considered for acceptance, whatever the end state of the kanban is). I suggest the problem preventing acceptance be kept with the item being considered for said acceptance.

Feature splitting doesn’t generate a bug report, it generates another feature, presumably worded the same way that any other feature is worded. Still no bug report.

And we would again advocate for its adoption given the value it brings to the user community in the context of all the other features being considered.

Posted in  All, Agile Testing, Planning for Quality, Requirements & Testing | Tagged , , , , , , , , , , | Comments Off on Feature Advocacy

Role of Outsourcing: Finding Your Vision

On February 24, 2011, I presented “Role of Outsourcing: Finding Your Vision” to VANQ.org, the Vancouver Software Quality Assurance User Group and I wanted to share that material with you.

Consciously deciding your outsourcing approach is similar to choosing to use risk to drive your testing – Your resulting strategy will be customized to your specific needs and constraints.

Often the outsourcing solution is not decided by the team but rather mandated or inherited (including the choice not to have one), much like the expensive software tools that sit on the proverbial shelf – Purchased without a proper needs vs. solutions analysis, or a plan of how to implement and roll-out to gain the full breadth of promised benefits.

In the recent whitepaper “Survey Report – Project Success & Test Outsourcing”, it seemed that responses generally supported the feeling that the software industry has advanced in the last 10 years with respect to its attitude towards project success, customer satisfaction and quality, and including outsourcing of testing as part of the solution to that success.  But it was still clear that some organizations have the opportunity to see significant improvement benefits by reviewing how they are structured internally and how they conduct their quality and test efforts whether there is the intention to outsource or not.

In the following presentation, the software testing function of an organization is used to discuss crafting a multi-faceted sourcing solution model aimed at providing benefits on a combination of fronts including cost efficiency, capacity scalability, optimized communication, domain expertise capture/retention, specialized skills access, centralized strategic planning and accountability, etc.

Perhaps there is such an opportunity to identify and organize the teams, their activities and processes within your organization to realize such benefits as well, enabling a greater capability for overall project success.

Read the full article…


Posted in  All, Business of Testing, Other | Tagged , , , | Comments Off on Role of Outsourcing: Finding Your Vision

Going To The Extreme – xBTM

Now that the project has finished it is time to sum up my experiences of adapting Thread-Based Test Management (TBTM). Since I generally do not believe in rigorously adhering to a protocol, I ended up not using TBTM strictly, but instead embraced a hybrid of Session-Based Test Management (SBTM) and TBTM. Naturally this hybrid will be denoted xBTM.

The project
In order for this text to make sense, a few words on the project are needed. The customer runs an application that generates output which is stored daily in a single XML file, and later used by the customer’s own applications to derive vital business statistics. There were defects that needed correction, and the customer also asked for new features regarding how log on/log off was recorded. The corrections as well as the new requirements should be implemented in a new file that was supposed to be generated in parallel with the old file for a transition period.

The team
It was a small project. I acted as project manager, test manager and tester. Later in the project I was joined by a second tester. There was one single developer.

TBTM
Most of the time my working environment in general is simply too hectic and borderline chaotic for SBTM to be suitable. There tends to be a lot on interruptions and distractions, and it is rarely possible to sit down and focus on a single test task for a given time period. Therefore I decided to give TBTM a try when a new project started.

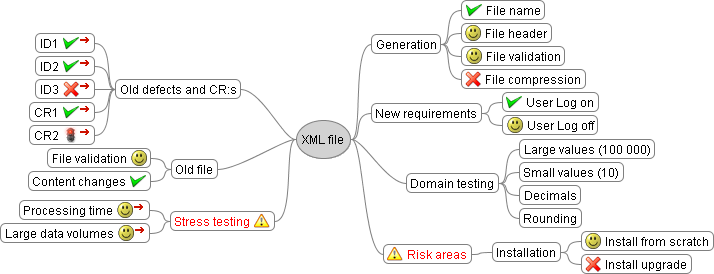
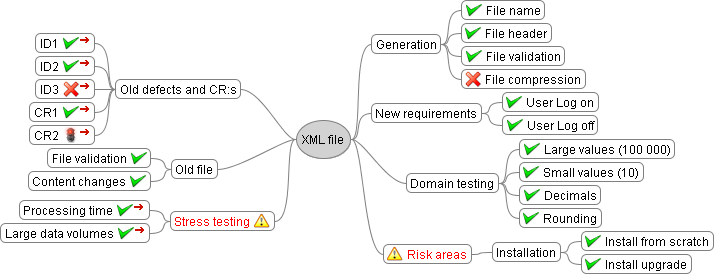
My first step was to make a mind map containing all my test ideas as threads. Since I am very fond of open source products I used the software FreeMind. In the mind map below, e.g. File Name is a thread. XML file is the actual product. ID denotes a defect, and CR denotes a new change request. The test threads are grouped in two ways. Most groups represent key areas, e.g. Generation which means file generation. Other groups are formed based on the type of testing, e.g. Stress testing. In some cases I felt short notes were needed to explain the thread, and in those cases I attached text files – knots – to the thread. These files are shown as red arrows in the mind map. You click on the arrow to open the text file.

Test PlanTest Plan

I tried using colours and icons to make the mind map easier to read. The warning signs mark key areas that I judged to be high risk and especially important. The stop light marks a thread that was tied off. That particular change request was retracted by the customer just before the project started. The initial mind map as it was before I started testing made up my test plan and was sent to the customer.

During the test period I would constantly be updating the mind map and it would always give me an accurate picture of the current status of the testing. As soon as I started working on a thread I would mark it with a smiley, see image below. Threads where I found defects were marked with a red cross, and threads where I felt sufficient testing for delivery had been done (not the same thing as claiming to be done testing!) were checked off in green.

TestSnapshot of mind map in the middle of the test period
Initially my goal was to write daily status reports containing a few short notes on what I had done. In reality I only kept this up for four days. With my constantly updated mind map and the occasional session report (see below) I really did not feel a need for it.

When there was no more time for testing, I took the current status of my mind map and used it as my test report, see below. This test report was sent to the customer.

Test ReportTest Report

SBTM
I do still like SBTM and I find the session reports as well as the time-boxing very useful, so when circumstances would allow, I created test charters and ran time-boxed test sessions. Typically a couple of threads would make one session, but in come cases one thread deserved a session of its own. For example, looking at the test plan the two threads File name and File header belonging to the key area File generation would be tested in the same session, whereas Install from scratch and Install upgrade belonging to the key area Installation were tested in separate sessions.

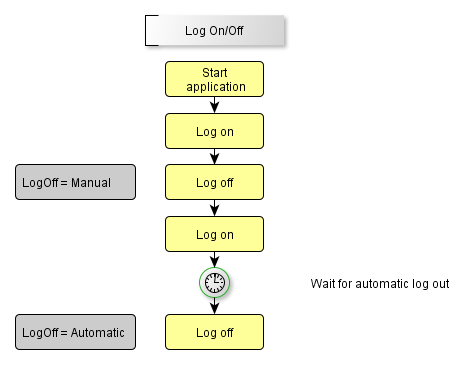
In most cases I would draw a simple activity diagram – pattern – for each test charter, see example below. I prefer using yEd for my diagrams.

Log on/offTest Charter

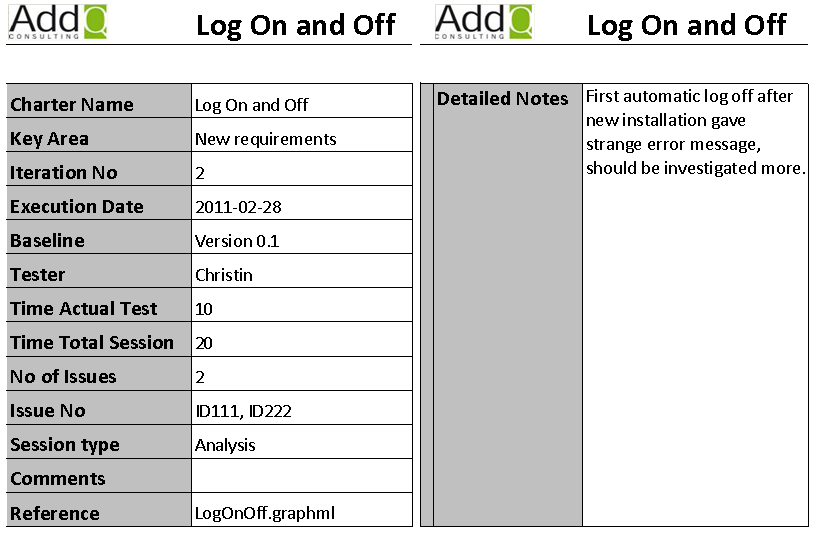
I wrote short session reports according to a new AddQ session report template, see image below.

SBTM ReportSBTM session report template

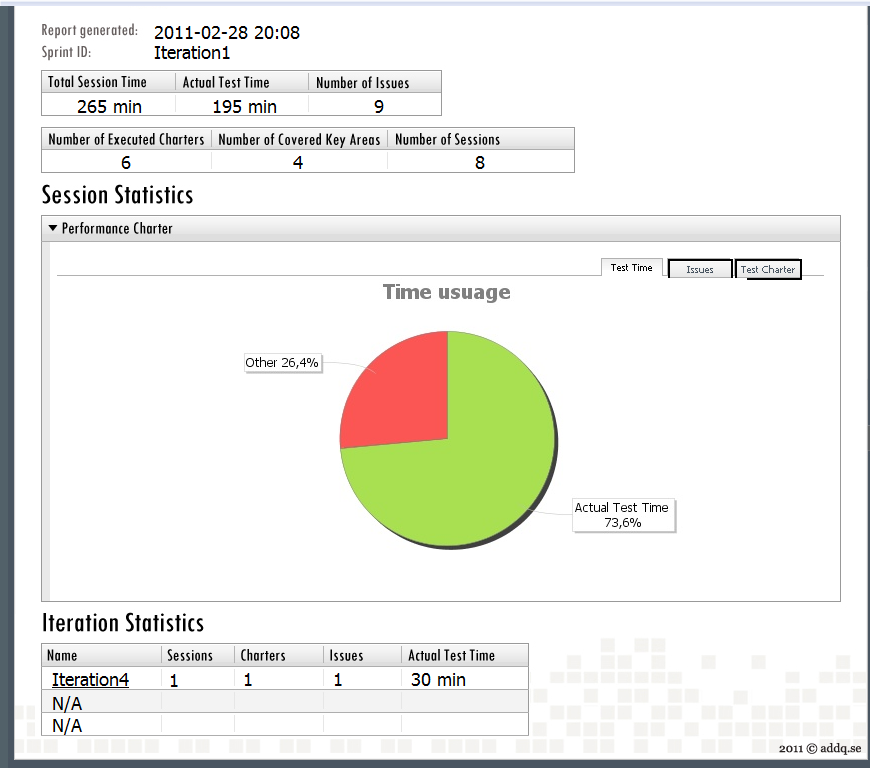
Using the AddQ tool SBTExecute I could then derive metrics such as Total session time (for all sessions), Number of test charters, Number of test charters per key area, and so on from my session reports. However, since I was still experimenting in this project, as well as working on the template and the tool as I went along, I could not obtain any useful statistics. Also note than any metrics derived would only be valid for my SBTM sessions – and a considerable part of the testing was done according to TBTM.

SBT ExecuteSummary report generated by SBTExecute

Summary and Conclusions
What is the main difference to previous projects I have worked on? Well…the first thing that comes to mind is that this time I actually used the test plan! And I have read and come back to the test report. Keeping the mind map up to date has been much easier than updating any other kind of status document, which means that it actually has been updated. As it turned out, even the developers liked it – they preferred looking at the mind map over using our bug tracking tool!

I immediately liked the combination of TBTM and SBTM – it is a simple matter of applying the methodology that is best suited for the task at hand. Some threads were fairly isolated and straight forward to test, making them suitable for SBTM. Other threads were very convoluted and had to be explored together with the developer, making them better suited for TBTM.

Posted in  All, Agile Testing, Automation & Tools, Test Planning & Strategy | Tagged , , , , | Comments Off on Going To The Extreme – xBTM

Checklists, Refactored

Guided exploratory testing is using checklists to support and guide the exploration. In addition, it also means using those checklists as the backbone for communicating to other stakeholders on the project/initiative.

I’ve started to advocate the term ‘testlists’ to replace ‘checklists’ when they are used this way, that is, when checklists are used to support testing and the communications on and about a test initiative/mission (credit goes to Michael Bolton for positing the difference between checking and testing).

Supporting the Acceptance Decision

The procurement process for a new solution includes an acceptance decision, well-described by Gerard Meszaros, Grigori Melnick and Jon Bach in Acceptance Test Engineering Guide – Volume 1 (http://testingguidance.codeplex.com/).

The acceptance decision is usually undertaken late on the project life cycle in a critical-path “acceptance test phase”. This is true even if agile testing, acceptance test driven development (ATDD), or behaviour-driven development (BDD) is the development style of the team delivering the solution. I can’t emphasize that point enough. Ron Jeffries put it succinctly in a tweet:

“don’t care if they are ATDD’d. I’m a user of this stuff. Needs to be in the farking manual. if they had a farking manual” – Ron Jeffries

Ron was talking about adopting the software in question, the step that comes after the development and deployment. In short, what happens after ‘done’.

I’m advocating exploratory testing for finding the information needed to make the acceptance decision, as do many others. The tweak that I propose is the use of testlists to support collaboratively planning the exploration, for understanding where the explorers currently are, and for reporting to outsiders on the results, outsiders like internal/external auditors, steering committee members, board members, etc.

Checklists and Testlists

The difference between a checklist and a testlist is the following:

  • A checklist lists things to check; a testlist lists things to explore in and around.
  • To most people, a checklist is a means of tracking to completion. Check these items and you are done. A testlist is a list of places to start. Where you “end” depends on what you find in the micro-context of each item on the list.
  • A testlist has attributes such as risk, business value ranking, persona attached to the items so that explorers can use that information to decide what to explore first, given a limited amount of time.
  • A testlist might be hierarchical to support communicating to different audiences. A testlist might also evolve into a mind map depending on the usage and in that case be called a testmap.

We use testlists in the format of the one-page project manager (http://oppmi.com/) so that we can also provide testlist audiences with an indication of status and when/who will do the exploration/investigation. But really any format will do. The content of the testlist has been business processes/workflows/functions from the business user’s perspective, or if one exists, the starting point for the testlist content can be the story map that guided the solution development.

Posted in  All, Agile Testing, Automation & Tools, Test Planning & Strategy | Tagged , , , , , , , | Comments Off on Checklists, Refactored